
COVID-19
Epidemic Forecasting

Abstract
Since the beginning of the COVID-19 pandemic, many dashboards have emerged as useful tools to monitor its evolution, inform the public, and assist governments in decision-making. We proposed a general methodology to produce forecasts on a one-week horizon, which is applicable to close to 200 countries, and as many states/regions or provinces. An additional challenge to achieve this goal is that the quality of the reported data varies significantly from country to country. This translates into different fluctuations and irregularities that can be observed in the reported time-series. Many countries do not report on a daily basis or delay their reports to particular days of the week. In particular, seasonal patterns with a weekly cycle are observed for many countries. It is important to note that (a), seasonal patterns are non-stationary and can actually change in time, in particular, if the reporting policies change. Furthermore, delays in reporting, changes in death cause attribution protocols, as well as changes in testing policies lead to abrupt corrections that introduce backlogs on some days, such that a number of daily cases or deaths which are anomalously high or even negative are reported. To take into account these peculiarities, we proposed a forecasting methodology that relies on estimating the underlying trend with a robust seasonal-trend decomposition method and using simple extrapolation techniques to make a forecast over a week.
People
Collaborators

Tao Sun joined SDSC as a Computer Scientist in March 2020. Tao holds a MSc in Electrical & Electronic Engineering from EPFL, where he specialized in data analytics and developed a keen interest in machine learning. Before coming to Switzerland, he completed his undergraduate studies in Zhejiang University (Hangzhou, China) with a major in Electronic Information Engineering and a minor in Public Administration.

Gavin joined the SDSC in Zurich as a Data Science Engineer in 2020. He holds an MSc in Computational Science and Engineering from EPFL, where he completed his Master's thesis in an SDSC collaboration with the Harvard T.H. Chan School of Public Health on a biostatistics research project. Prior to coming to Switzerland, he completed a BSc in Financial Mathematics and Statistics at the University of Sydney and subsequently worked in various financial institutions. Currently, he is interested in statistical software and data visualisation.

Dorina is a Senior Data Scientist at the Swiss Data Science Centre since December 2016. Prior to that, she was a postdoctoral researcher at the Signal Processing Laboratory (LTS4) of EPFL, Switzerland. She got her M.Sc. and Ph.D. in Communication Systems and Electrical Engineering respectively, both from EPFL, and her Diploma in Electrical and Computer Engineering from the University of Patras, Greece. In summer 2014, she was a research intern with Microsoft Research, Redmond, USA, working on the compression of 3D point clouds. Her research interests include graph-based signal processing for data representation and analysis, as well as machine learning, with a particular focus on the design of interpretable models for personalized medicine. After four years at the Swiss Data Science Center, Dorina has joined the pole of the Center for Intelligent Systems (CIS) at EPFL on Medicine and Healthcare as an AI Research Scientist.

Benjamín Béjar received a PhD in Electrical Engineering from Universidad Politécnica de Madrid in 2012. He served as a postdoctoral fellow at École Polytechnique Fédérale de Lausanne until 2017, and then he moved to Johns Hopkins University where he held a Research Faculty position until Dec. 2019. His research interests lie at the intersection of signal processing and machine learning methods, and he has worked on topics such as sparse signal recovery, time-series analysis, and computer vision methods with special emphasis on biomedical applications. Since 2021, Benjamin leads the SDSC office at the Paul Scherrer Institute in Villigen.
Ekaterina received her PhD in Computer Science from Moscow Institute for Physics and Technology, Russia. Afterwards, she worked as a researcher at the Institute for Information Transmission Problems in Moscow and later as a postdoctoral researcher in the Stochastic Group at the Faculty of Mathematics at University Duisburg-Essen, Germany. She has experience with various applied projects on signal processing, predictive modelling, macroeconomic modelling and forecasting, and social network analysis. She joined the SDSC in November 2019. Her interests include machine learning, non-parametric statistical estimation, structural adaptive inference, and Bayesian modelling.

Christine received her PhD in Applied Mathematics in 2003 (Paris Dauphine University). She joined the Swiss Data Science Center in 2019 from the Harvard T.H. Chan School of Public Health where she was a Senior Research Scientist and an instructor in the Master of Science in Health Data Science. Her research interests are statistical software, reproducible workflows, and environmental policy and health policy. Recent published works include the New England Journal of Medicine, the Journal of the American Medical Association, and the Annals of Applied Statistics.

Guillaume Obozinski graduated with a PhD in Statistics from UC Berkeley in 2009. He did his postdoc and held until 2012 a researcher position in the Willow and Sierra teams at INRIA and Ecole Normale Supérieure in Paris. He was then Research Faculty at Ecole des Ponts ParisTech until 2018. Guillaume has broad interests in statistics and machine learning and worked over time on sparse modeling, optimization for large scale learning, graphical models, relational learning and semantic embeddings, with applications in various domains from computational biology to computer vision.
description
Motivation
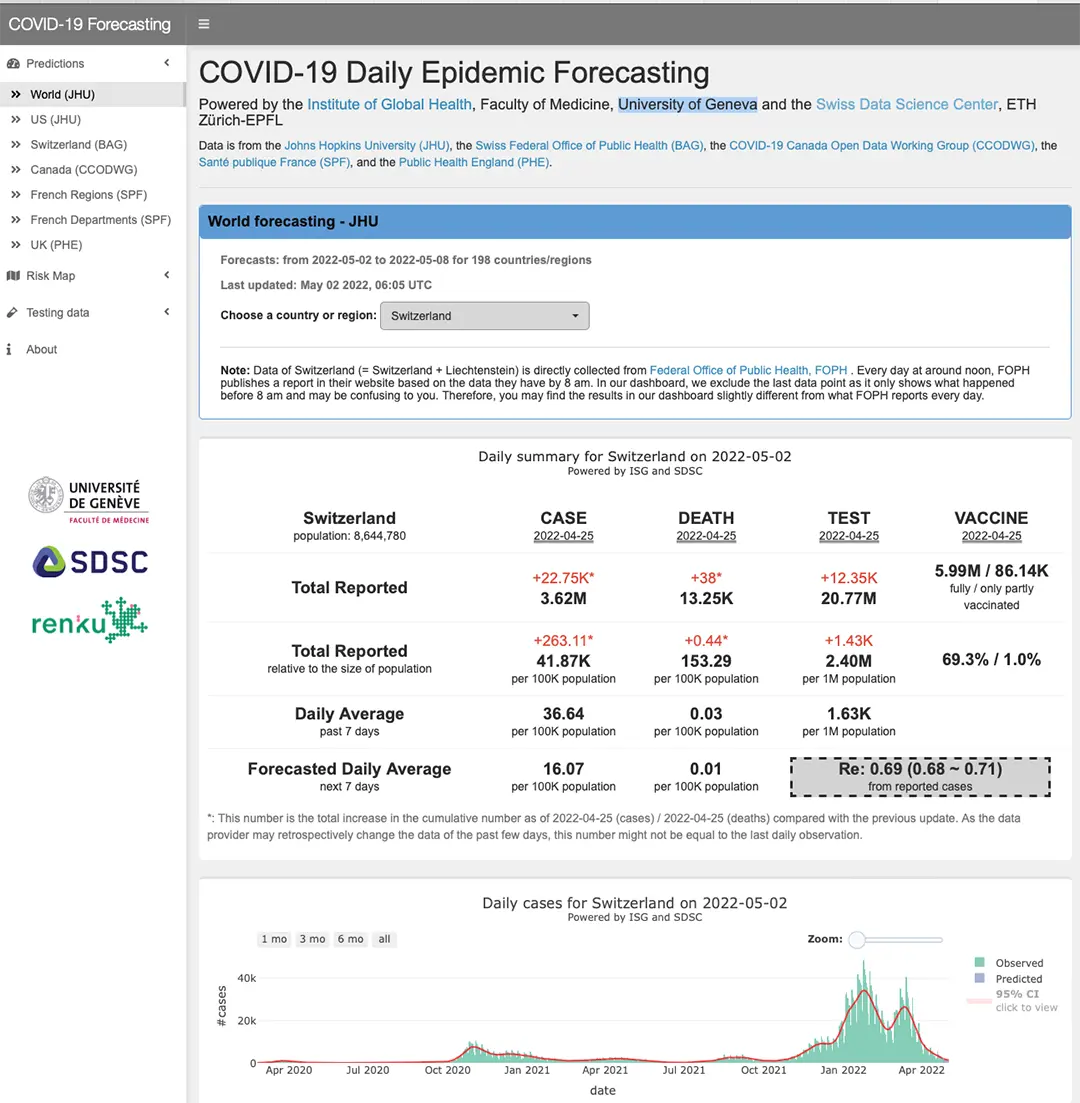
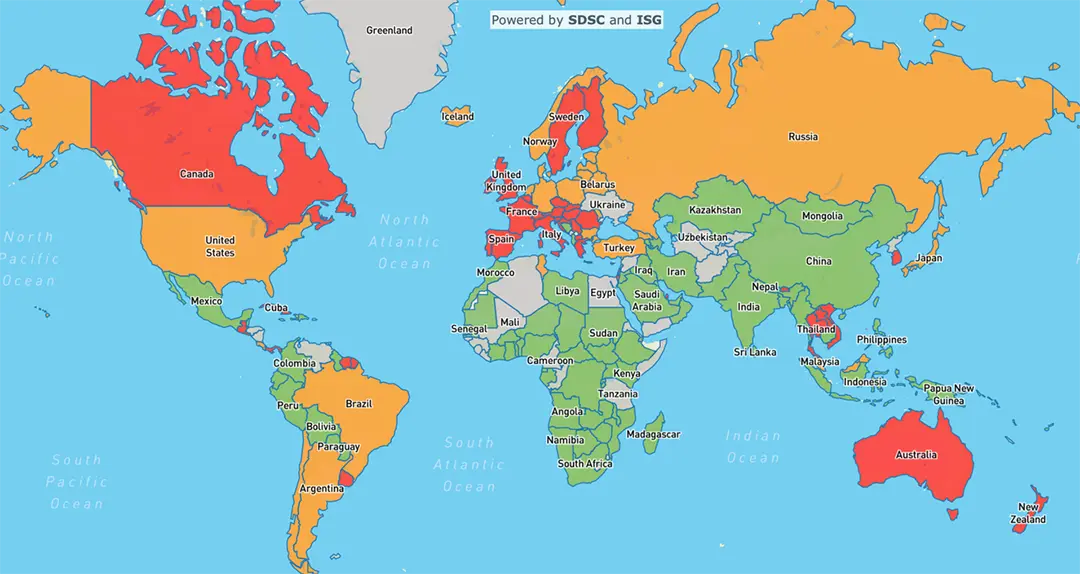
Our goal was to develop a globally applicable method, integrated in a twice-daily updated dashboard (Fig.1) that provides an estimate of the trend in the evolution of the number of cases and deaths from reported data of more than 200 countries and territories, as well as a seven-day forecast and a weekly risk map (Fig. 2). One of the significant difficulties to manage a quickly propagating epidemic is that the details of the dynamic needed to forecast its evolution are obscured by the delays in the identification of cases and deaths and by irregular reporting.
Proposed Approach / Solution
Our forecasting methodology substantially relies on estimating the underlying trend in the observed time series using robust seasonal trend decomposition techniques. This allows us to obtain forecasts with simple, yet effective extrapolation methods in linear or log scale.
Impact
The dashboard has been actively used by epidemiologists and global health experts to analyze the evolution of the epidemiological situation and to provide recommendations to several European governments.
Presentation
Gallery
Annexe
Additional resources
Bibliography
Publications
More projects
ACROSS

Dedgeflow

CHUV: Heracles - Sepsis Model

AI-Driven Political Monitoring
More projects
News
Latest news
SDSC and PSI teams jointly explore the AI potential of large-scale infrastructures
SDSC and PSI teams jointly explore the AI potential of large-scale infrastructures
Coding the Future: Energy Data Hackdays Expand to French-speaking Switzerland
Coding the Future: Energy Data Hackdays Expand to French-speaking Switzerland

Science des données : le SDSC et le Canton de Vaud soutiennent quatre projets appliqués
Science des données : le SDSC et le Canton de Vaud soutiennent quatre projets appliqués
Contact us
Let’s talk Data Science
Do you need our services or expertise?
Contact us for your next Data Science project!